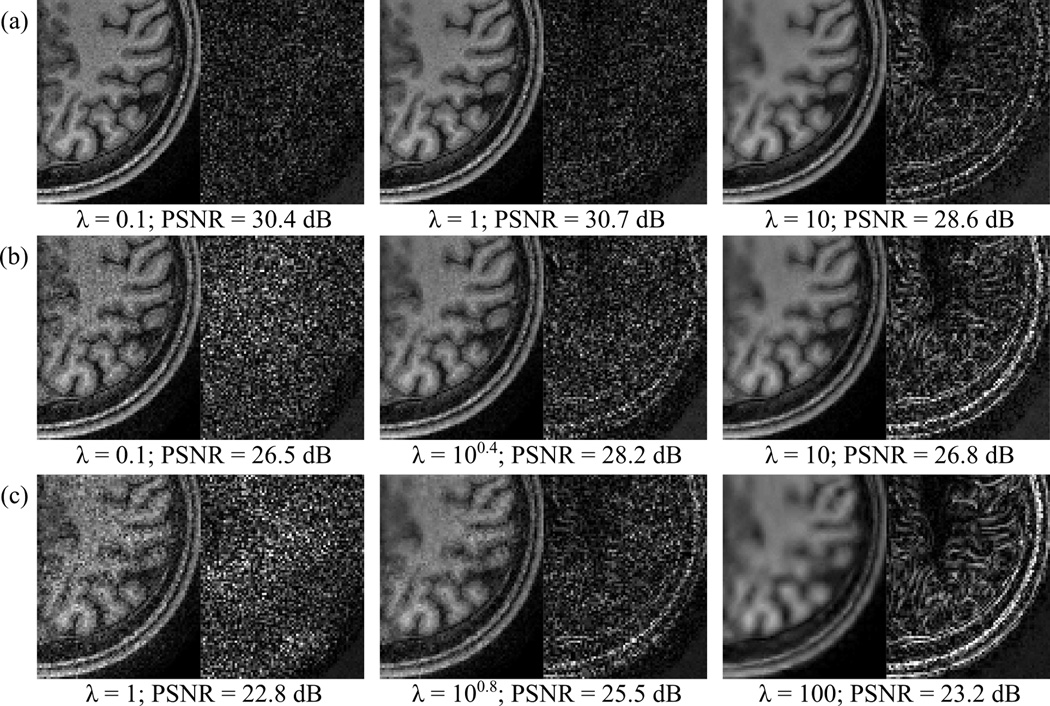
Figure 2.
DESIGN denoising results and difference images as λ increases, for the ℓ1 norm with (a) R = 8.7, (b) R = 10.5, and (c) R = 12.0 uniform undersampling, all with the four-level ‘9-7’ DWT. The value of λ increases from left to right, and the results for the PSNR-optimal choice of λ for this dataset is shown in the center column. When λ is small, DESIGN resembles GRAPPA, and as λ increases, denoising and smoothing affect the result more noticeably. At high acceleration, these results suggest choosing a value of λ that denoises without excessive blurring becomes more challenging.

