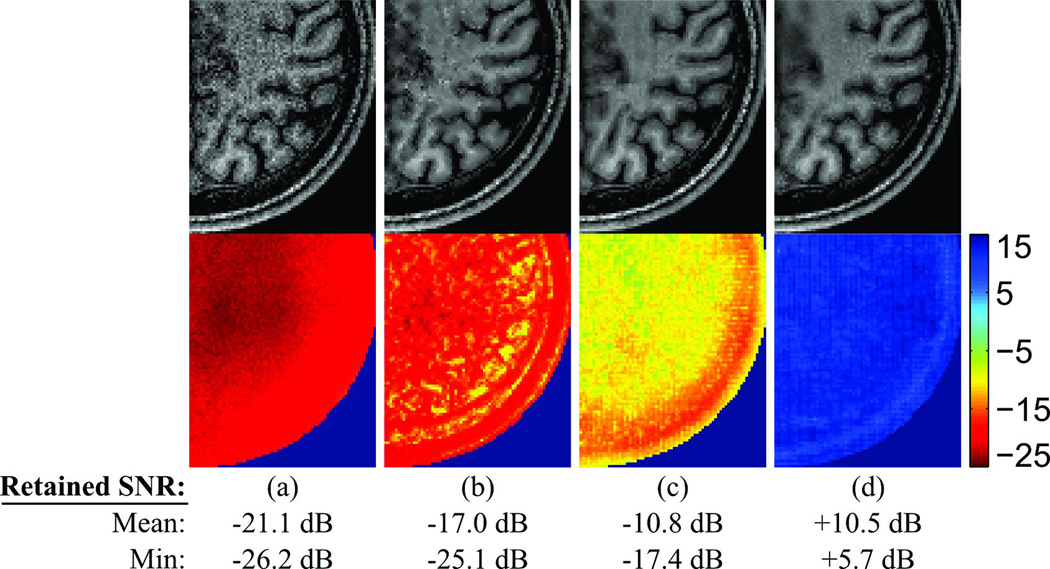
Figure 8.
The retained SNR in dB is compared across (a) GRAPPA, (b) GRAPPA with multichannel adaptive local Wiener filter-based denoising, (c) L1 SPIR-iT, and (d) DESIGN denoising using the first dataset and the pseudo-multiple replica method with 400 Monte Carlo trials, for the four-level ‘9-7’ DWT with R = 10.5 uniform undersampling. The mean and minimum retained SNR correspond to the average and minimum gain/attenuation over the image, excluding the region without signal. The corresponding magnitude images for these reconstructions from Figure 4 are shown above for reference. The retained SNR maps are plotted on the same color scale to facilitate comparison.

