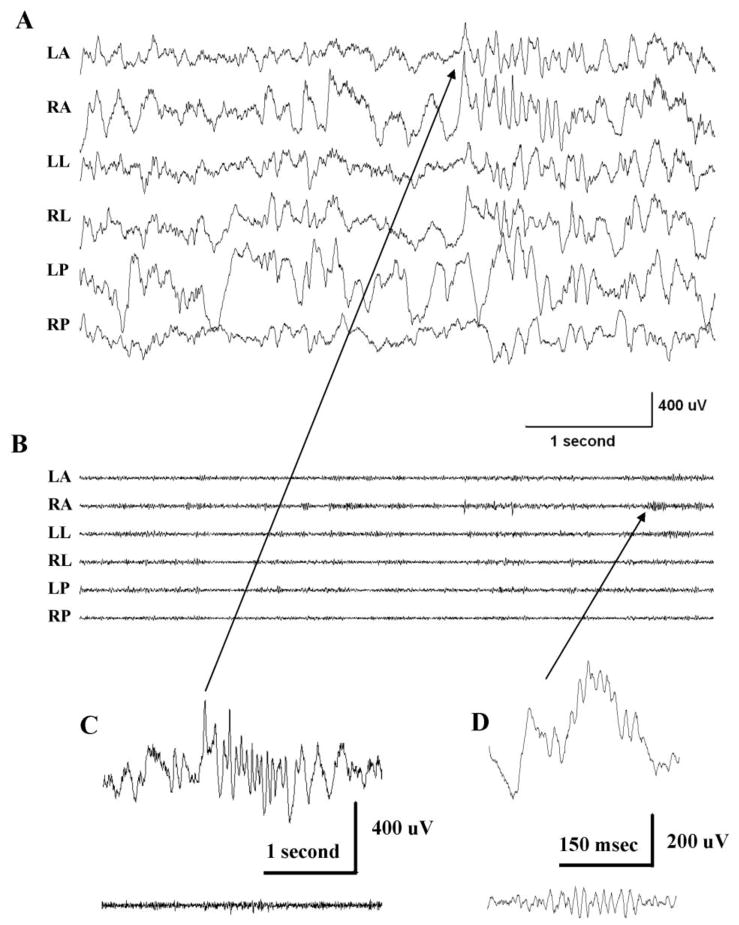
Figure 3.
High frequency EEG activity during NREM sleep in a control rat. (A) An excerpt taken of the final 5 sec of Figure 1C and shown here at an expanded time base. (filtered at 0.5–500 Hz). (B) The same recordings as in A but filtered at 80–500 Hz to illustrate high frequency activity. (C) A sleep spindle recording from electrode RA (see arrow). (D) HFO of ripple frequency also recorded on RA. Upper traces in C and D filtered at 0.5–500 Hz – lower traces 80–500 Hz.

