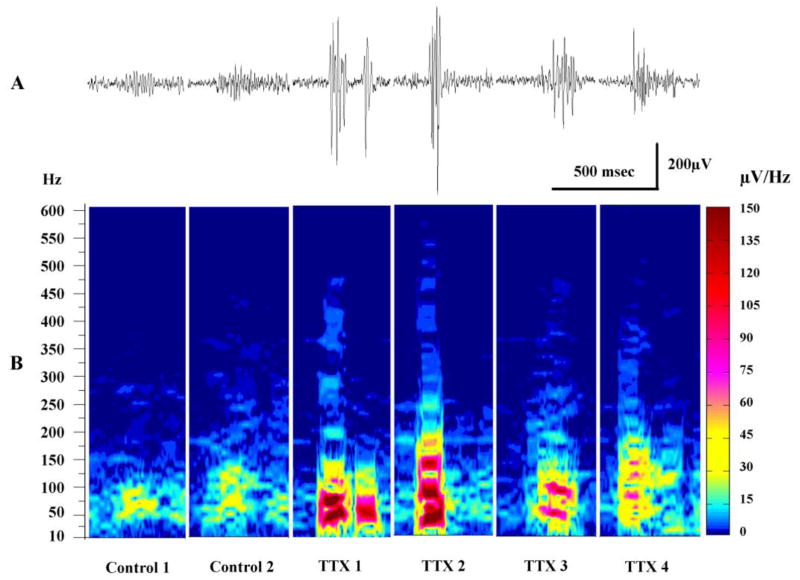
Figure 5.
Comparison of typical HFOs recorded from control and epileptic rats. (A) Traces show representative HFOs recorded from 2 control rats and 4 TTX-infused rats – filter: 80 – 500 Hz. (B) Spectral plots for the same events shown above; however raw EEG recordings were analyzed to illustrate the full complement of frequencies in these events. Notice the marked differences in amplitude of the HFOs as well as the intensity of the power spectra between control and experimental animals.

