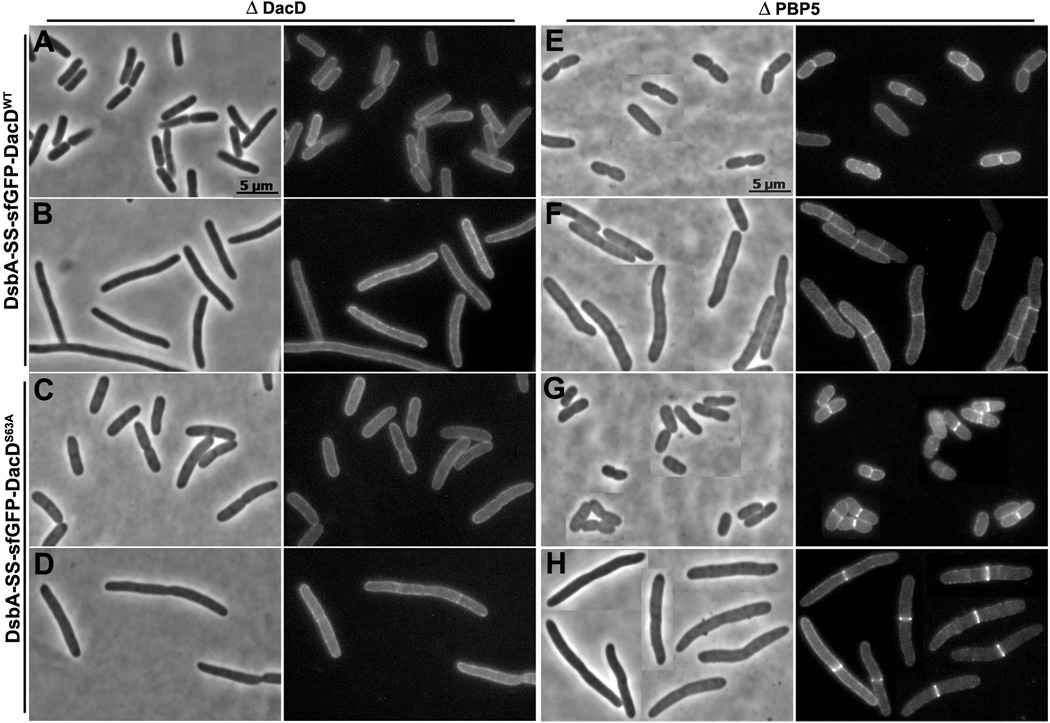
Fig. 8. sfGFP-DacD localizes to the septum in cells lacking PBP5.
E. coli CS18-1 (ΔDacD) expressing DsbA-SS-sfGFP-DacD from pLP652 (A and B), or DsbA-SS-sfGFP-DacDS63A from pLP656 (C and D). E. coli CS12-7 (ΔPBP5) expressing DsbA-SS-sfGFP-DacD from pLP652 (E and F), or DsbA-SS-sfGFP-DacDS63A from pLP656 (G and H). Cells in panels B, D, F and H were filamented by treating with 1 µg/ml of aztreonam for 1 MD. Each panel has a phase contrast image on the left and the corresponding fluorescence image on the right. The fluorescence images in panels E, F, G and H were processed similarly. All images have same magnification, and the scale bars in panels A and E equal 5 µm.

