
Figure 1.
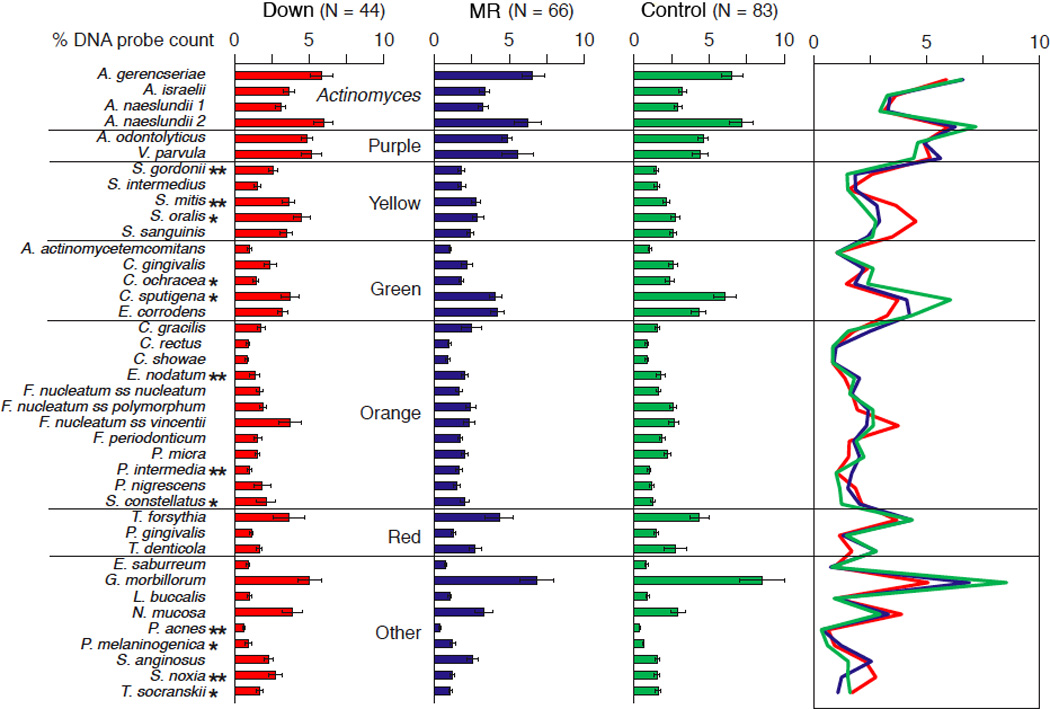
Bar chart of mean % of the DNA probe count of individual species in subgingival plaque samples taken from Down syndrome, non-DS mentally retarded (MR), and mentally normal (control) subjects. The bars represent the mean percentages and the whiskers the standard error of the mean. The % of the DNA probe count for each species was computed per subject and then averaged across subjects in each group.
* P < 0.05, ** P < 0.01.