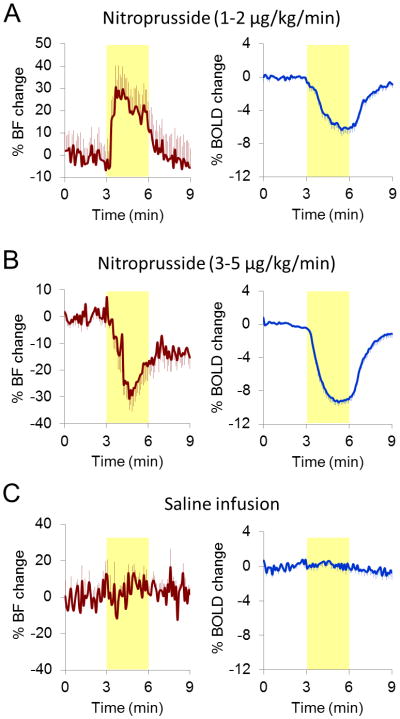
Figure 2.
Averaged pharmacological MRI time-courses. Yellow-shaded regions indicate the nitroprusside infusion durations. (a) Nitroprusside infusion increased BF but decreased BOLD signal in the retina/choroid at low dose (13 trials). (b) At high dose, BF showed sustained reduction and BOLD signal decreased (14 trials). (c) Saline infusion showed no effect on BF and BOLD signals (9 trials).

