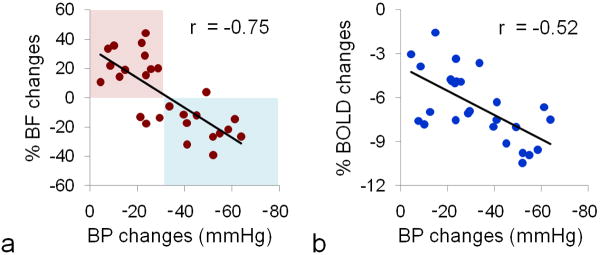
Figure 3.
Nitroprusside-induced arterial BP, chorioretinal BF and BOLD changes (n = 7, total 27 trials). Significant linear correlation was observed between BF and MABP changes (p=0.000007) and between BOLD and MABP changes (p=0.005). Positive BF responses were mainly observed with smaller MABP changes (i.e., lower nitroprusside dosage, red-shaded area), whereas negative BF responses were mainly observed with larger MABP changes (i.e., higher nitroprusside dosage, blue-shaded area). No positive BOLD response was observed across 27 trials.

