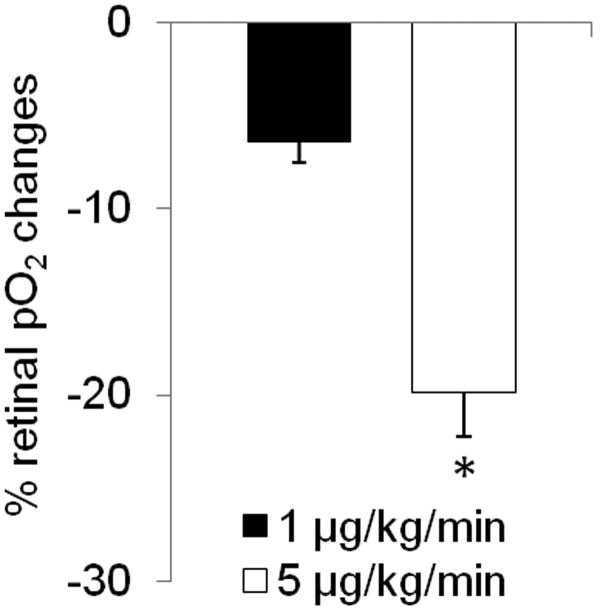
Figure 4.
Effect of nitroprusside infusion on vitreous pO2 (at the vitreoretinal boundary) changes as measured by fiber optic oxygen probe (n = 3). Both the lowest and the highest infusion doses showed vitreous pO2 reduction. The vitreous pO2 changes were significantly stronger with 5 μg/kg/min than 1 μg/kg/min nitroprusside infusion (p=0.009). Error bars are s.e.m. values.

