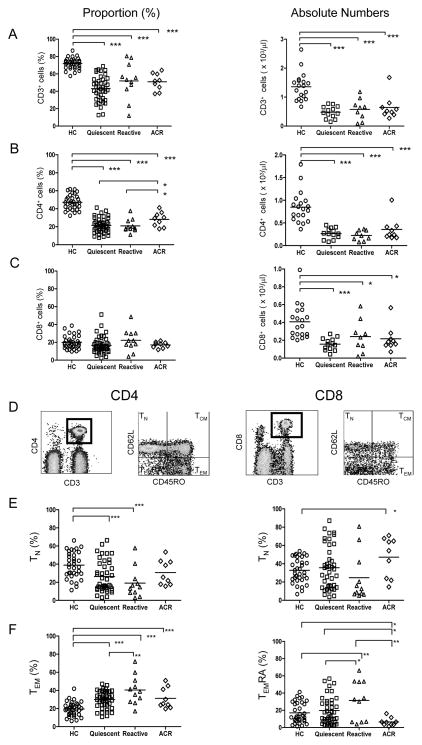
Figure 1. Identification and quantitation of peripheral blood T cell subsets.
Proportion (%) and absolute numbers of CD3+ (A), CD3+CD4+ (B), and CD3+CD8+ (C) T cells in each study group. (D) Gating strategy for identifying TN (CD45RO−CD62L+), TCM (CD45RO+CD62L+), TEM (CD45RO+CD62L−), and TEMRA (CD45RO−CD62L−) CD4 and CD8 T cells. (E–F) Proportion (%) of CD4+ TN, TEM, and CD8+ TN, TEMRA cells for each study group. Each symbol represents a single subject, while the horizontal line reprsents the mean value. *p<0.05; ** p<0.01; *** p<0.005.

