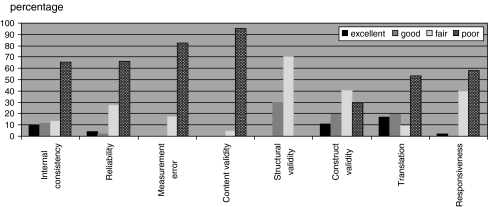
Fig. 1.
Percentage of studies with excellent, good, fair, or poor quality. Included number of studies: Internal consistency 35; reliability 36; measurement error 21; content validity 16; structural validity 11; construct validity (hypotheses testing) 41; translation 25; responsiveness 37 (criterion validity was not assessed in any of the studies)

