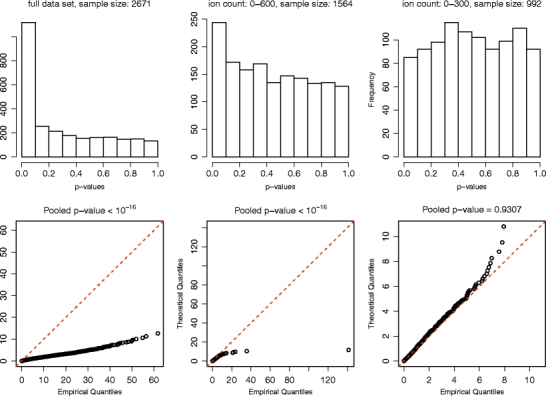
Figure 2.

Top: histograms of the P values associated with the X2 statistics obtained from the individual scans over each of the three ion count ranges by using the pure Poisson model to construct the likelihood ratio test. Bottom: quantile-quantile plots of the X2 statistics themselves compared with the theoretical X2 1-distribution. The P values obtained for the pooled data-sets are listed above the quantile-quantile plots. Only for the lowest range of ion counts do the statistics appear to conform reasonably well to the X2 1-distribution predicted by the likelihood ratio test
