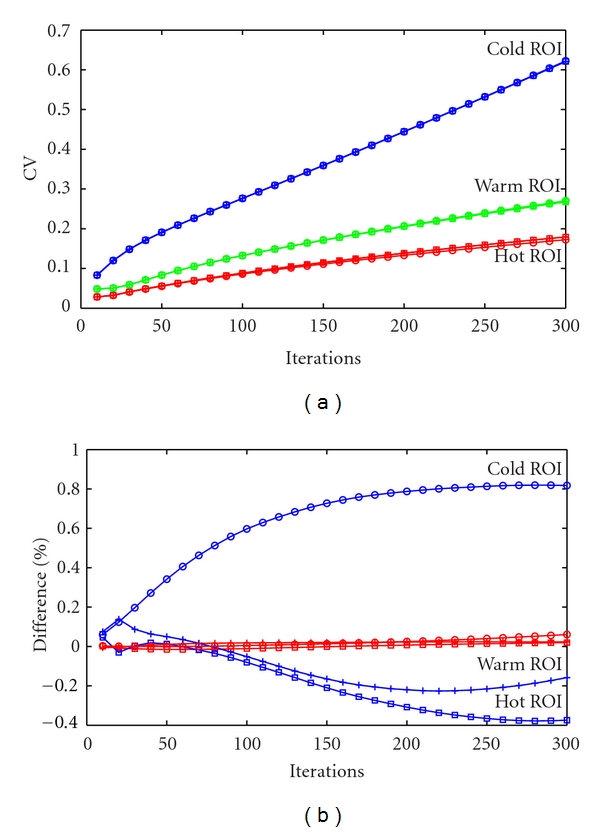
Figure 4.

CV measured in the hot (red), warm (green), and cold (blue) ROI for the CPU-single-core implementation (□), the CPU-multicore implementation (+), and the GPU implementation (∘) for 300 iterations measured every 10 iterations (a). The differences in % between the CPU-single-core/CPU-multicore (red) and CPU-single-core/GPU (blue) implementations for the hot (□), warm (+), and cold (∘) ROI are shown in (b).
