
Figure 6.
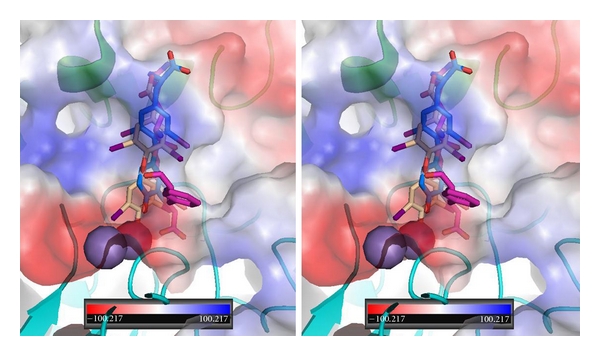
Stereoview of QM/MM model for T3 (blue-Ca2) and T4ac (beige) bound in αvβ3 integrin at the RGD peptapeptide (violet) binding site. The electrostatic surface for integrin is shown. Red is negative and blue is positive surface. αv domain is green and β3 domain is cyan. Spheres (purple/violet) are Ca2+/Mg2+. Figure drawn with PyMol.