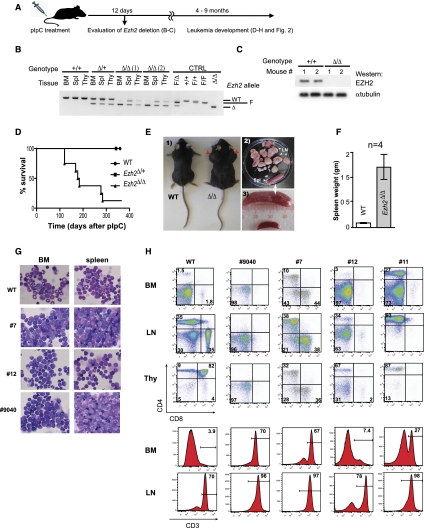
Figure 1.
Leukemia development in Ezh2-deficient mice. (A) Outline of the experimental approach. (B) PCR-based analysis of Ezh2 deletion in hemopoietic tissues at 12 d after pIpC treatment. Primer pairs (sequence available on request) amplify a 314-base-pair (bp) wild-type (WT) Ezh2 fragment, a 280-bp fragment identifying the conditional Ezh2F allele, and a 200-bp fragment of the excised Ezh2Δ allele. Tail clippings were used as a source of control DNA. (C) Western blot analysis of EZH2 levels in bone marrow cells of wild-type and Ezh2F/Δ mice 12 d after pIpC treatment. α-Tubulin levels are shown as a loading control. (D) Kaplan-Meier survival plot of pIpC-treated wild-type, Ezh2F/+, and Ezh2F/Δ mice. The day of the last pIpC injection was designated as day 0 of the experiment. (E, panel 1) Photograph of a representative sick Ezh2F/Δ mouse showing enlarged lymph nodes (red arrows). Note also a bloated appearance, suggesting the presence of an abdominal mass. An age-matched mouse from the control wild-type cohort is shown for comparison. (Panel 2) Lymph nodes and spleen of an Ezh2F/Δ mouse shown in panel 1. A wild-type spleen is shown for comparison in panel 3. (F) Splenomegaly of the sick Ezh2F/Δ mice. Result shown represents mean spleen weight ± SD; n = 4. (G) Wright stain-dyed cytospin preparations of bone marrow and spleen cells from a sick Ezh2F/Δ mouse; 40-fold magnification. Mouse identification numbers are shown at the left. (H) Phenotypical characterization of Ezh2F/Δ leukemias. (Top panels) Proportions of CD4+ and CD8+ cells. (Bottom panels) Proportions of CD3+ cells in the bone marrow and lymph nodes. Mouse identification numbers are shown at the top, and tissues analyzed are indicated at the left. (BM) Bone marrow; (LN) lymph node; (Thy) thymus.

