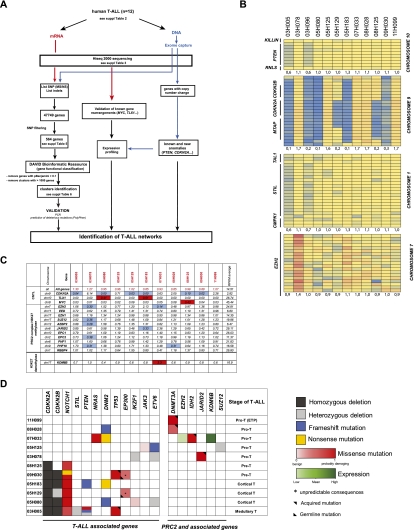
Figure 3.
Characterization of genetic anomalies in human adult T-ALL. (A) Flow chart for the identification of genetic alterations in human T-ALL. Transcriptome and exome sequencing allowed the identification of 47,749 nonsynonymous SNPs, indels, and other anomalies (copy number variants and deletions). Following filtering (see the Materials and Methods), 564 genes were retained (listed in Supplemental Table 6). Gene annotation enrichment analysis with DAVID Bioinformatics Resources (Huang et al. 2009) identified chromatin regulators (shown in C,D; Supplemental Fig. 4) and the ubl conjugation pathway as significantly perturbed in these specimens (see Supplemental Table 7). All genetic anomalies were validated using exon sequencing, and acquired mutations were validated as described in the Materials and Methods and are shown in Supplemental Table 8. (B) Copy number variants in selected genes using exon capture sequencing (see the Materials and Methods for details). All chromosomes were manually inspected: Selected genes that appeared relevant (e.g., EZH2) or redundantly deleted (CDKN2A/B) are shown. The correlation between expression level and copy number variation is presented in Supplemental Figure 3B for EZH2. The color code refers to change from mean RPKM values (yellow) per exon. Blue and red indicate lower and higher RPKM values, respectively. (C) Expression of relevant control (CDKN2A, TLX1, and MYC) and EZH2-associated genes in all T-ALL patients studied herein. Data are expressed in relative RPKM values, with mean absolute values per gene is shown in the last column. Note high levels of MYC and TLX1 restricted to leukemia with rearrangements in these genes (see Supplemental Table 2) and low EZH2 expression in two leukemias, including one (07H033) with high KDM6B expression. (D) Representation of mutations, indels, and deletions found in T-ALL genes (left panel) and PRC2 and associated genes (right panel). The functional effects of nonsynonymous substitutions (color gradient) were predicted by the PolyPhen-2 program (http://genetics.bwh.harvard.edu/pph/data).

