Figure 3.
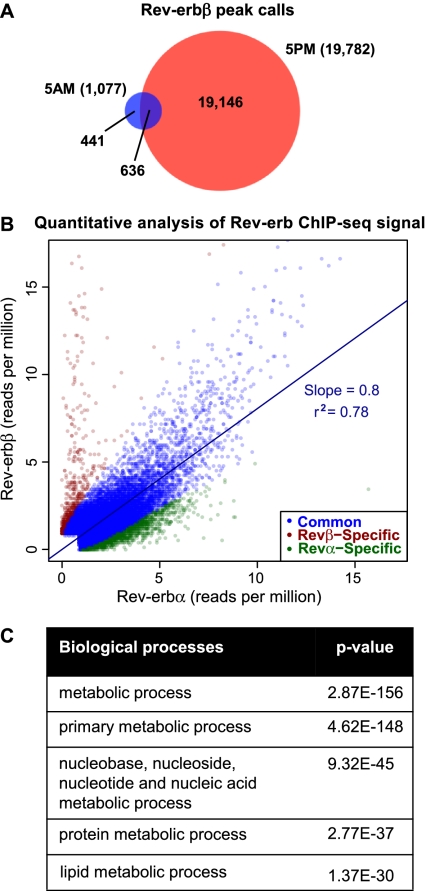
Extensive correlation of liver Rev-erbβ and Rev-erbα cistromes. (A) Overlap of the liver Rev-erbβ cistromes generated at 5:00 a.m. and 5:00 p.m. Binding sites were considered overlapping when the peak calls overlapped by at least 1 bp. Numbers indicate the total number of binding sites in each cistrome and the number of binding sites in each group. (B) Quantitative analysis of Rev-erb ChIP-seq signal. Scatter plot of the maximum stack height at each Rev-erbα and Rev-erbβ site not detected by Rev-erbα ChIP in the Rev-erbα-null mouse. Sites are classified as subtype-specific if the difference in binding profiles is statistically significant (Fisher's exact test, Benjamini-Hochberg-corrected P-value < 0.05) and indicates at least a twofold difference in binding strength. For clarity, 16 common and 23 Rev-erbβ-specific outliers were omitted from the plot. r2 and the slope of the best-fit line are shown for common sites. (C) Gene ontology analysis (PANTHER) on genes with a Rev-erb-binding site within 10 kb of the TSS (Galaxy/Cistrome). Shown are the top five enriched GO terms.

