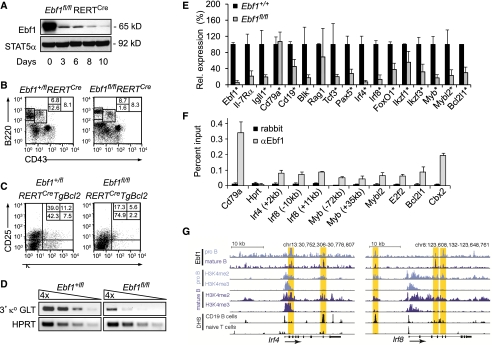
Figure 1.
Impaired B lymphopoiesis and expression of regulatory genes in Ebf1fl/flRERTCre bone marrow. (A) Immunoblot analysis to detect Ebf1 and Stat5a in lysates of splenic B cells from mice that were treated with tamoxifen 4-OHT (3 mg) on two consecutive days and sacrificed on various days after first administration. (B) Flow cytometric analysis of bone marrow to detect B220+CD43+ pro-B cells, B220intermediateCD43− pre-B cells, and B220highCD43− recirculating B cells. Numbers in quadrants indicate percentage of cells. (C) Flow cytometric analysis to detect differentiation and generation of CD25+κ− pre-B cells and CD25−κ+ immature B cells from CD19+CD43+c-kit− pro-B cells in fetal liver cell cultures. Cells cultured in the presence of OP9 feeders and IL-7 were treated with 2 μM 4-OHT for 24 h and cultured for an additional 4 d. Differentiation was induced by withdrawal of IL-7. (D) Semiquantitative RT–PCR analysis of κ light chain GLTs in pro-B cells that were cultured in the presence of OP9 feeders and IL-7 for 6 d and treated with 2 μM 4-OHT during the first day of culture. Data are representative of at least four (A) or three (B–D) experiments. (E) Quantitative RT–PCR analysis to examine the expression of B-cell-specific regulatory genes in pro-B-cell cultures. Data represent mean values of three independent biological replicates, and the raw cycle values were normalized to actin expression. Error bars indicate standard deviation (SD). (F) Quantification of Ebf1 binding to target genes in 38B9 cells by ChIP and quantitative PCR analysis. Binding is represented as percentage of input chromatin, and error bars represent SD of duplicate ChIP experiments (see also Supplemental Fig. S1; Supplemental Table S1). (G) Sequence tag profiles in pro-B cells and splenic B cells at the Irf4 and Irf8 loci. Regions of Ebf1 occupancy and H3K4me2 and H3K4me3 modifications in both pro-B cells (Lin et al. 2010) and splenic B cells (this study), as well as DNase I hypersensitivity sites (DHS) in CD19+ B cells and naive T cells (http://genome.ucsc.edu/ENCODE; Sabo et al. 2006), are shown. Tag density profiles are visualized using the University of California at Santa Cruz (UCSC) Genome Browser. Vertical yellow bars highlight genomic positions of Ebf1-binding sites that were identified by ChIP-seq analysis in pro-B cells (Lin et al. 2010; Treiber et al. 2010) and splenic B cells (this study).

