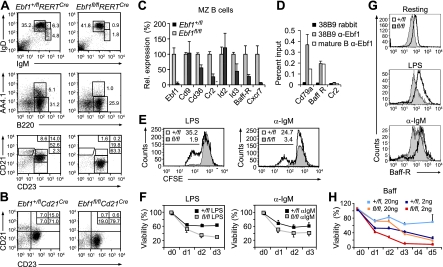
Figure 3.
Roles of Ebf1 in peripheral B-cell subsets and BAFF-R-mediated cell survival. (A) Flow cytometric analysis of Ebf1+/flRERTCre and Ebf1fl/flRERTCre splenocytes to detect IgMhiIgD+ immature B cells and IgMhiIgDhi mature B cells (top panels), IgMhiIgDhiB220+AA4.1+ transitional B cells (middle panels), and B220+CD23−Cd21hi MZ B cells and B220+CD23+CD21+ FO B cells (bottom panels). Numbers in quadrants indicate percentage of cells. (B) Flow cytometric analysis of Ebf1+/flCd21Cre and Ebf1fl/flCd21Cre splenocytes to detect MZ B cells and FO B cells. (C) Quantitative RT–PCR analysis of Ebf1-regulated targets in sorted MZ B cells. Fold expression values are relative to heterozygote control cells. (D) ChIP analysis to examine binding of Ebf1 to the Tnfrsf13c (Baff-R) locus in 38B9 pro-B cells or MACS-enriched splenic B cells. Binding is represented as percentage of input chromatin. (E) Flow cytometric analysis of proliferation of splenic B cells that were depleted of non-FO B cells with antibodies directed against CD43, CD4, CD8a, Gr1, AA4.1, and CD9. Cells sorted 10 d after the initial 4-OHT treatment were CFSE-labeled and stimulated with LPS or αIgM F(ab′)2. Proliferation was determined by CFSE dilution 3 d after stimulation. Numbers indicate percentages of cells in the area marked by the thin bar. (F) Analysis of apoptosis of LPS- or α-IgM-stimulated splenic B cells at the specified days (d) (n = 3). (G) Flow cytometric analysis of surface expression of BAFF-R in resting and stimulated splenic B cells. Cells were activated with the indicated stimuli for 40 h. The graph is representative of three experiments. (H) Analysis of the survival of Ebf1+/flRERTCre and Ebf1fl/flRERTCre resting splenic B cells in the presence of optimal (20 ng/mL) and limiting (2 ng/mL) exogenous BAFF (n = 3).

