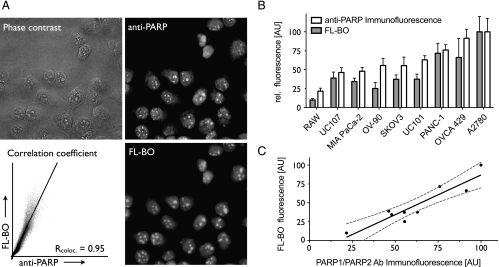
Figure 3.
Correlation of cellular FL-BO uptake and relative PARP expression. (A) In PANC-1 cells, there was an excellent correlation between intracellular FL-BO distribution and PARP-1/2 expression: phase contrast (top left), anti-PARP (top right), FL-BO (bottom right), and Pearson correlation coefficient of anti-PARP and FL-BO (bottom left). (B) Column representation of FL-BO uptake and anti-PARP immunofluorescence in different cell lines. (C) Correlation of FL-BO uptake and anti-PARP-1/2 immunofluorescence (dashed line indicates the 95% confidence band).

