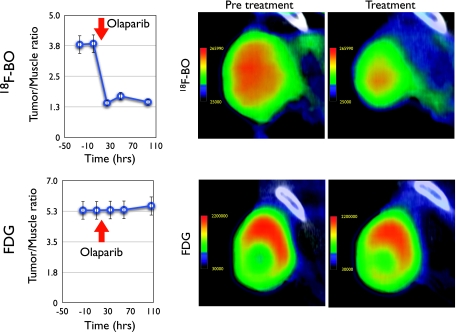
Figure 6.
Response of 18F-BO and 18F-FDG uptake to treatment with Olaparib measured in the same mouse. Left: Tumor/muscle plots at different time points before and after initiation of Olaparib treatment. Right: Representative PET-CT images of A2780 tumors (high PARP levels) before and after treatment. Note the changes with 18F-BO and the absence of changes with 18F-FDG. There were no appreciable CT changes in tumor volume during the 24-hour period after Olaparib injection.

