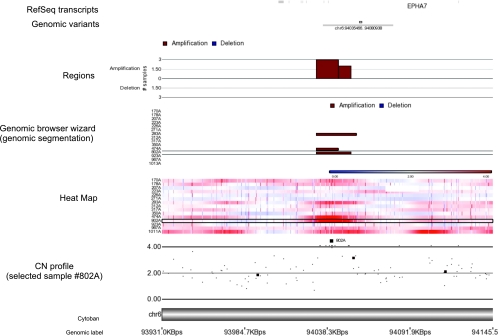
Figure 2.
A representative example of a single gene (ephrin receptor 7 [EPHA7] at chr 6q16.1; entire length, 179,563 bp) affected by a recurrent SNP-detected microamplification. The heat map shows the intensity plots in each sample (defined with sample ID). Gains/amplifications are represented in red and losses/deletions in blue. The CN profile is shown for three altered cases (nos. 283A, 474A, 802A). The genomic browser wizard shows the altered regions (gains represented in red and losses in blue) according to the genomic segmentation (Partek GS). Minimal overlapping regions in at least 2 samples (MORs) are reported in the upper panel (length of the MOR, 14,544 bp).

