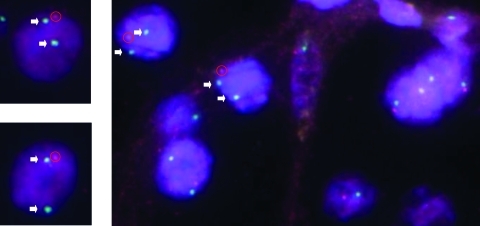
Figure 3.
Validation with FISH analysis of the CNAs detected with SNP array. Representative FISH-validated case with CN loss at the SGK1 locus (probe at 6q23.2) according to the SNP analysis (sample no. 350A): loss of the red signal (specific for the SGK1 probe) with respect to the green signal (centromere-specific reference probe) in more than 80% of cells. Arrows indicate the additional green signals, whereas red circles underline the red signals.

