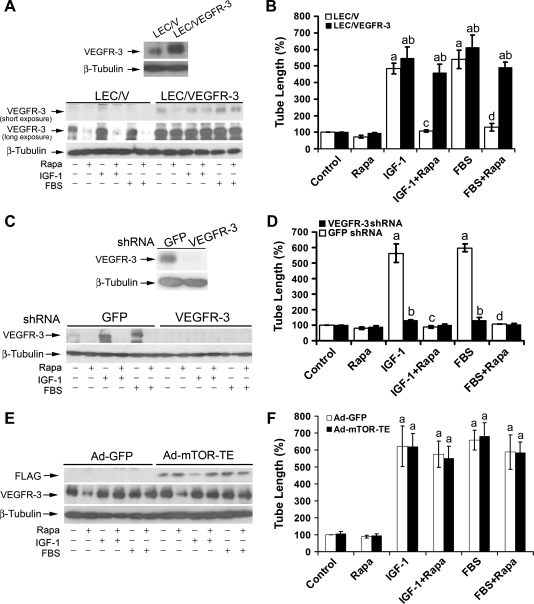
Figure 5.
Rapamycin inhibits LEC tube formation by downregulating VEGFR-3 protein expression. (A and B) Overexpression of VEGFR-3 confers high resistance to rapamycin inhibition of LEC tube formation. Overexpression of VEGFR-3 was detected in pooled clones of LECs stably transfected VEGFR-3 (LEC/VEGFR-3) but not in the control cells transfected with an empty vector (LEC/V) by Western blot analysis (A, upper panel). LEC/V (control) and LEC/VEGFR-3 cells were treated with rapamycin (Rapa, 100 ng/ml) for 24 hours, in the presence or absence of IGF-1 (10 ng/ml) or 2% FBS, followed by Western blot analysis with the indicated antibodies (A, bottom panel) or tube formation assay (B). Quantitative results of tube formation are shown as mean ± SD (n = 3) in (B). aP <.05, difference versus control group. bP <.05, difference versus LEC/V group. cP < .05, difference versus IGF-1 group. dP < .05, difference versus FBS group. (C and D) Down-regulation of VEGFR-3 mimics the effect of rapamycin, inhibiting IGF-1/FBS-stimulated tube formation. Lentiviral shRNA to VEGFR-3, but not GFP, downregulated VEGFR-3 protein expression in LECs, as detected by Western blot analysis with the indicated antibodies (C, upper panel). LECs, infected with lentiviral shRNAs to VEGFR-3 and GFP (control), respectively, were treated with rapamycin (Rapa, 100 ng/ml) for 24 hours, in the presence or absence of IGF-1 (10 ng/ml) or 2% FBS, followed by Western blot analysis with the indicated antibodies (C, bottom panel) or tube formation assay (D). Quantitative results of tube formation are shown as mean ± SD (n = 3) in D. aP < .05, difference versus control group. bP <.05, difference versus GFP shRNA group. cP < .05, difference versus IGF-1 group. dP <.05, difference versus FBS group. (E and F) Overexpression of VEGFR-3 renders high resistance to rapamycin inhibition of tube formation in LECs expressing mTOR-TE. LEC/VEGFR-3 cells were infected for 24 hours with Ad-GFP and Ad-mTOR-TE, respectively, and then serum starved for 24 hours. Subsequently, the cells were treated with or without rapamycin (Rapa, 100 ng/ml) for 24 hours, in the presence or absence of IGF-1 (10 ng/ml) or 2% FBS, followed by Western blot analysis with the indicated antibodies (E) or tube formation assay (F). Quantitative data are presented as mean ± SD (n = 3) in F. aP < .05, difference versus control group.

