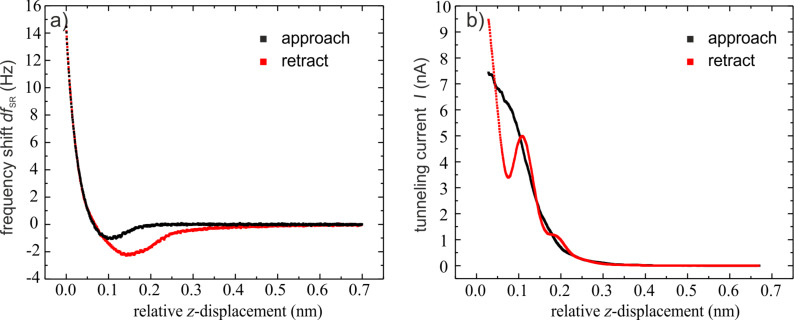
Figure 3.
(a) Frequency-shift versus distance curve. The contribution from the long-range forces has been subtracted. The spectroscopy measurement was recorded with an oscillation amplitude of 2.8 Å and a bias voltage of 0.1 V to eliminate the electrostatic interaction. The black curves represent the approach of the tip to the surface, the red curves the retraction. (b) Simultaneously recorded tunneling current.

