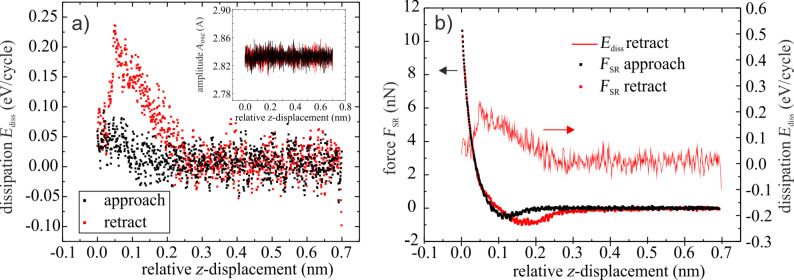
Figure 5.
(a) Dissipation signal for approach (black dots) and retraction (red dots). The inset displays the simultaneously recorded oscillation amplitude. The maximum in the dissipation signal is found during the retraction. (b) Dissipation signal for the retraction together with the calculated force–distance curves.

