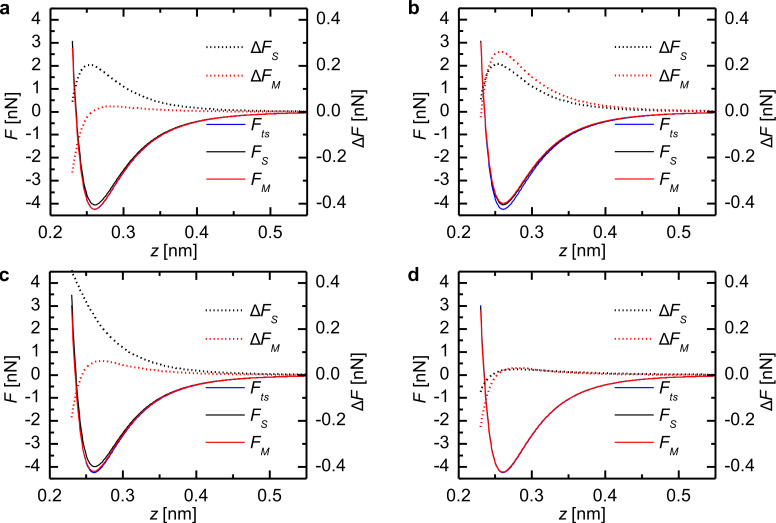
Figure 6.
Model force Fts(z), deconvoluted force curves FS/M(z) and the residuals ΔFS/M(z) for the Lennard-Jones force law with selected oscillation amplitude. (a) Amplitude 1 in Figure 5 (11.7 pm) with R2 = 0.9996 for the matrix method. (b) Amplitude 2 in Figure 5 (12.0 pm) with R2 = 0.996 for the matrix method. (c) Amplitude 3 in Figure 5 (23 pm) with R2 = 0.994 for the Sader–Jarvis method. (d) Amplitude 4 in Figure 5 (58.3 pm) with R2 ≈ 1 for the Sader–Jarvis method.

