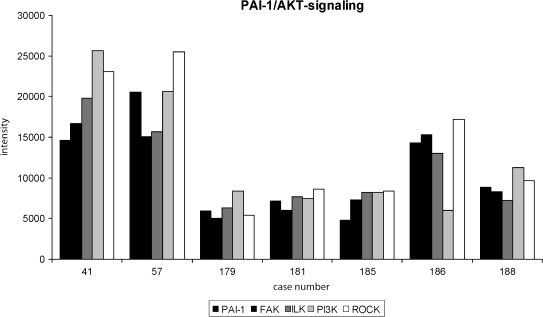
Figure 1.
Parallel analysis of FAK, ILK, PI3K, and ROCK expression in correlation to PAI-1 expression. A selection of seven representative tumors is shown in the figure. Normalized signal intensity of the different proteins obtained by RPPA analysis is depicted. All four proteins of the PI3K/AKT signaling pathway are expressed at similar levels compared with PAI-1 expression in six of seven patients. For one patient (no. 186), a single protein (PI3K) is expressed in a different manner than the rest of the pathway. In only 4 of the analyzed 52 patients, a single protein was regulated in a different manner than the rest of the pathway.

