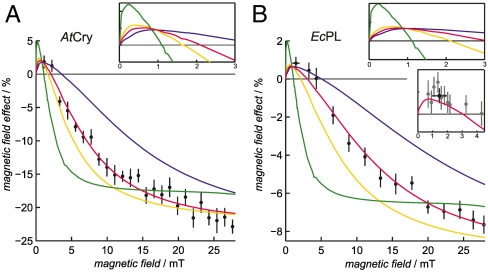
Fig. 6.
Magnetic field-dependence of the yield of RP2 in AtCry and EcPL. The percentage change in the yield of RP2 (measured at 510 nm) as a function of the strength of the applied magnetic field for (A) AtCry and (B) EcPL. Experimental conditions: (A) AtCry, 60% glycerol, 270 K; (B) EcPL, 50% glycerol, 260 K. The red lines are the best-fit simulations obtained using the singlet-triplet dephasing model described in the text, with kf = 2.5 × 10⁵ s-1 and (A) kb = 4.9 × 10⁵ s-1,kSTD = 1.1 × 10⁷ s-1; (B) kb = 1.2 × 10⁵ s-1,kSTD = 2.7 × 10⁷ s-1. The other lines are simulations with the same values of kf and kb but (A) kSTD/s-1 = 0 (green), 5 × 10⁶ (yellow), 5 × 10⁷ (blue); (B) kSTD/s-1 = 0 (green), 1 × 10⁷ (yellow), 1 × 10⁸ (blue). The two larger insets show expanded views of the simulations in the low field region. The irregularities visible in some of these curves arise from energy-level anticrossings. The smaller inset in (B) shows, on an expanded scale, the best-fit simulation together with 8 measurements in the range 0.7–2.2 mT that were averaged to obtain the (black) point plotted at B = 1.5 mT in this inset and in the main panel. The error bars associated with this data point represent ± one standard deviation of the eight measurements. Each data point in the main panels is the average of (A) 10 and (B) 40 (> 3 mT) or 80 (< 3 mT) transients. At each applied magnetic-field strength B, the double-difference kinetic time profiles ΔA(B) - ΔA(0) were smoothed with (A) 5 μs and (B) 0.5 μs boxcar functions. The mean ± standard deviation (calculated over the time intervals: (A) 2–170 μs and (B) 7–15 μs is plotted for each datum.

