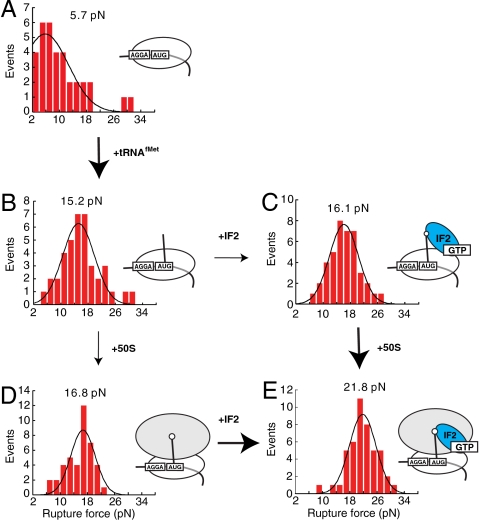
Fig. 2.
The rupture force distribution during early initiation steps. Each distributions fitted by Gaussian function have peak rupture force displayed above fitting curve. (A) 30S∶mRNA. (B) 30S∶tRNAfMet∶mRNA. (C) 30S∶IF2(GTP)∶fMet-tRNAfMet∶mRNA. (D) 70S∶fMet-tRNAfMet∶mRNA. (D) 70S∶IF2(GTP)∶fMet-tRNAfMet∶mRNA complexes. In the absence of IF2 50S subunit joining does not affect initiation complex stability. The presence of IF2 increases stability of the initiation complex by 5 pN upon large subunit joining. The arrow and bold arrow indicate no change and larger change in rupture force respectively.

