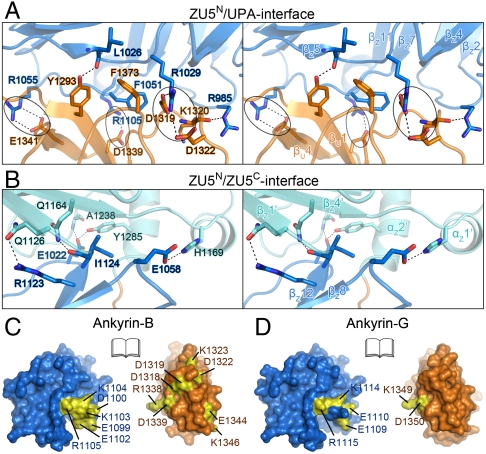
Fig. 3.
The ZU5N/UPA and ZU5N/ZU5C interfaces of ankyrin-B ZZUD. The molecular details are shown for the ZU5N/UPA (A) and ZU5N/ZU5C (B) interfaces. The salt bridges and hydrogen bonds are indicated as dashed lines. The three charge pairs in the ZU5N/UPA interface are highlighted by circles. The open-book views of the surfaces of the ZU5N/UPA interfaces in ankyrin-B (C) and -G (D) demonstrate that the identified loss-of-function mutations (colored in yellow) in ankyrin-B and -G (8, 21) are concentrated within or in the vicinity of the ZU5N/UPA interfaces of both ankyrins. The ankyrin-G ZZU structures are modeled by using the ankyrin-B ZZU structure as the template.

