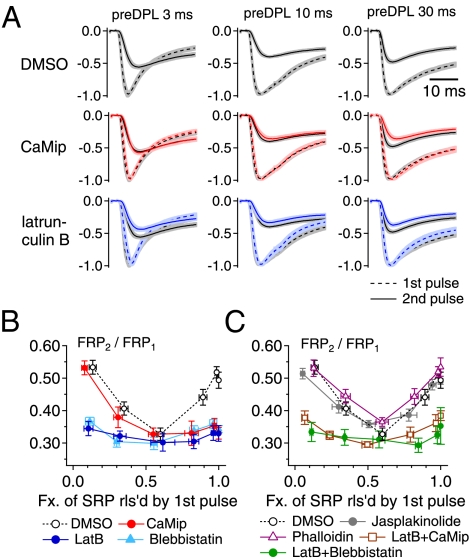
Fig. 2.
The SDR of the FRP depends on polymerized actin filaments. (A) Averaged traces of the first and second EPSCs (EPSC1 and EPSC2) normalized to the peak amplitude of EPSC1. Each row shows the normalized EPSC1 (broken line) and EPSC2 (solid line) evoked by a dual-pulse protocol (as shown in Fig. 1) with different preDP durations (Left, 3 ms; Middle, 10 ms; Right, 30 ms). Traces in each row were obtained with presynaptic treatment with the same drug: (Top) DMSO 1/1,000 as a control, n = 10; (Middle) 20 μM CaMip, n = 7; (Bottom) 15 μM latB, n = 6. Black traces in each panel represent the averaged EPSC traces evoked by the same pulse protocol under control conditions. Shading indicates the SE range of an averaged trace. (B) Mean values for the recovered fraction of the FRP at the second pulse (FRP2/FRP1) as a function of the fraction of SRP released by the first pulse under control conditions (open circles) or in the presence of CaMip (red circles), blebbistatin (light blue triangles), or latB (blue circles). (C) Mean values for the size of the recovered FRP (FRP2/FRP1) in the presence of jasplakinolide (gray circles), phalloidin (magenta triangles), latB plus CaMip (brown squares), or latB plus blebbistatin (green circles). The control values (open circles) are superimposed for comparison. Statistical values for recovered fractions after a preDP3, a preDP10, and a preDP30 under each condition are given in Table S1. Error bars indicate SEM.

