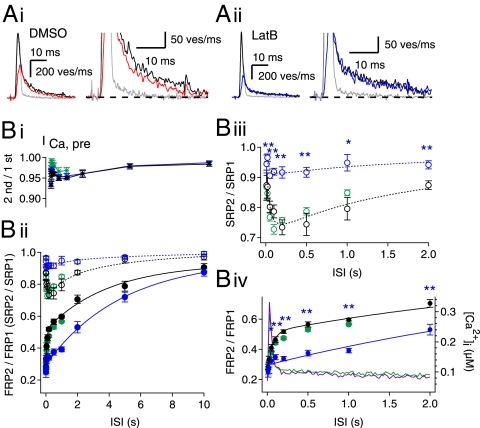
Fig. 3.
Recovery time course of the FRP and concomitant change in the SRP size after a preDP3. (A, i) Representative quantal release estimated from EPSCs evoked by a naive DP30 (black trace) and a DP30 after a preDP3 (red trace) (ISI = 0.2 s; see also Fig. S1A). Note that the quantal release rate at the second pulse (red trace) is lower than the release rate for the naive pulse (black trace) in both the fast phase (Left) and the slow phase (Right; same traces as left in an expanded scale) under control condition. (A, ii) There is no difference in the naive pulse (black trace) and the DP30 after a preDP3 (blue trace) (ISI = 0.2 s; see also Fig. S1B). The gray trace in each panel represents a quantal release by a preDP3. (B) The ratio of the second amplitude to the first amplitude of the presynaptic Ca2+ current (B, i), and the sizes of the FRP (filled circles) and SRP (open circles) (B, ii) as a function of ISI after a preDP3 under control conditions (black symbols; n = 15 synapses) or in the presence of latB (blue symbols; n = 9 synapses) or CaMip (green symbols; n = 5 synapses). Each size was normalized to the naive size evoked by a DP30. A double-exponential function was fitted to the time course of FRP recovery under the control condition (τfast = 0.06 s and τslow = 3.97 s; solid black line), and a monoexponential function was fitted to the recovery time course in the presence of latB (τ = 4.83 s; solid blue line). A log-normal function, A·exp[−(ln(x/x0)/σ)2], was fitted to the change in the SRP size under control conditions or in the presence of latB (control: x0 = 0.19, A = −0.30, σ = 3.33 s, dotted black line; latB: x0 = 0.16, A = −0.11, σ = 3.97 s, dotted blue line). (B, iii and iv) Time courses of SRP recovery (B, iii) and FRP (B, iv) shown in an expanded scale. Averaged traces of Ca2+ transients evoked by a preDP3 were recorded at the calyx terminals loaded with 0.45 EGTA plus 0.05 Fura-4F and are superimposed in B, iv (control, green; latB, magenta; right ordinate). Error bars indicate SEM. *P < 0.05; **P < 0.01.

