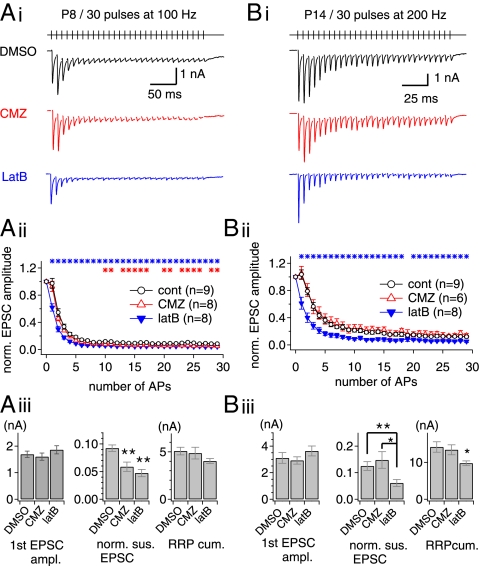
Fig. 7.
Effects of actin disruption on short-term depression at the immature (postnatal days 7–9) and mature (postnatal days 13–15) calyx of Held synapses. (A, i). Representative EPSC traces evoked by stimulation of afferent axons (30 stimuli at 100 Hz) at the immature calyx of Held synapses in the presence of DMSO (vehicle; black trace), CMZ (red trace) or latB (blue trace). (A, ii) Mean values for amplitude of EPSCs normalized to the first EPSC amplitude under different conditions (control, open black circles; CMZ, open red triangles; latB, filled blue triangles). Asterisks indicate significant differences (P < 0.05) between control and latB (blue asterisks) or CMZ (red asterisks) conditions. (A, iii) Mean values for the first EPSC amplitude (Left), normalized amplitudes of the last 10 EPSCs (Middle), and the RRPcum estimate (Right) under control (DMSO), CMZ, and latB conditions. (Left) Neither CMZ nor latB affected the baseline EPSC amplitude (DMSO, 1.69 ± 0.12 nA, n = 9; CMZ, 1.60 ± 0.14 nA, n = 8, P = 0.62; latB, 1.86 ± 0.15 nA, n = 8, P = 0.40). (Center) Normalized amplitudes of the last 10 EPSCs were reduced significantly by CMZ (DMSO, 0.092 ± 0.006; CMZ, 0.059 ± 0.008) and by latB (0.047 ± 0.007). **P < 0.01. (Right) The RRPcum in the presence of latB (4.03 ± 0.26 nA) was marginally smaller than in the control condition (5.07 ± 0.40 nA) or in the presence of CMZ (4.86 ± 0.61 nA) (P = 0.053). (B, i) Effects of CMZ and latB on short-term plasticity of ESPCs at the mature calyx of Held synapse (postnatal days 13–15). Experimental conditions are as in A except for the higher stimulation frequency (200 Hz). (B, ii). Normalized amplitude of EPSCs under different conditions (control, open black circles; CMZ, open red triangles; filled blue triangles, latB). (B, iii) In the first EPSC amplitude, no significant difference was found between the three conditions (DMSO, 3.11 ± 0.40 nA, n = 9; CMZ, 2.92 ± 0.27 nA, n = 6, P = 0.74; latB, 3.63 ± 0.37 nA, n = 8, P = 0.36). The sustained EPSC amplitude was reduced significantly by latB (DMSO, 0.13 ± 0.02; latB, 0.06 ± 0.01) but not by CMZ (0.15 ± 0.03; P = 0.50). The RRPcum was reduced significantly by latB (DMSO, 14.14 ± 1.42 nA; latB, 9.75 ± 0.65 nA; P = 0.017) but not by CMZ (13.40 ± 1.34 nA, P = 0.73). Error bars indicate SEM. *P < 0.05; **P < 0.01.

