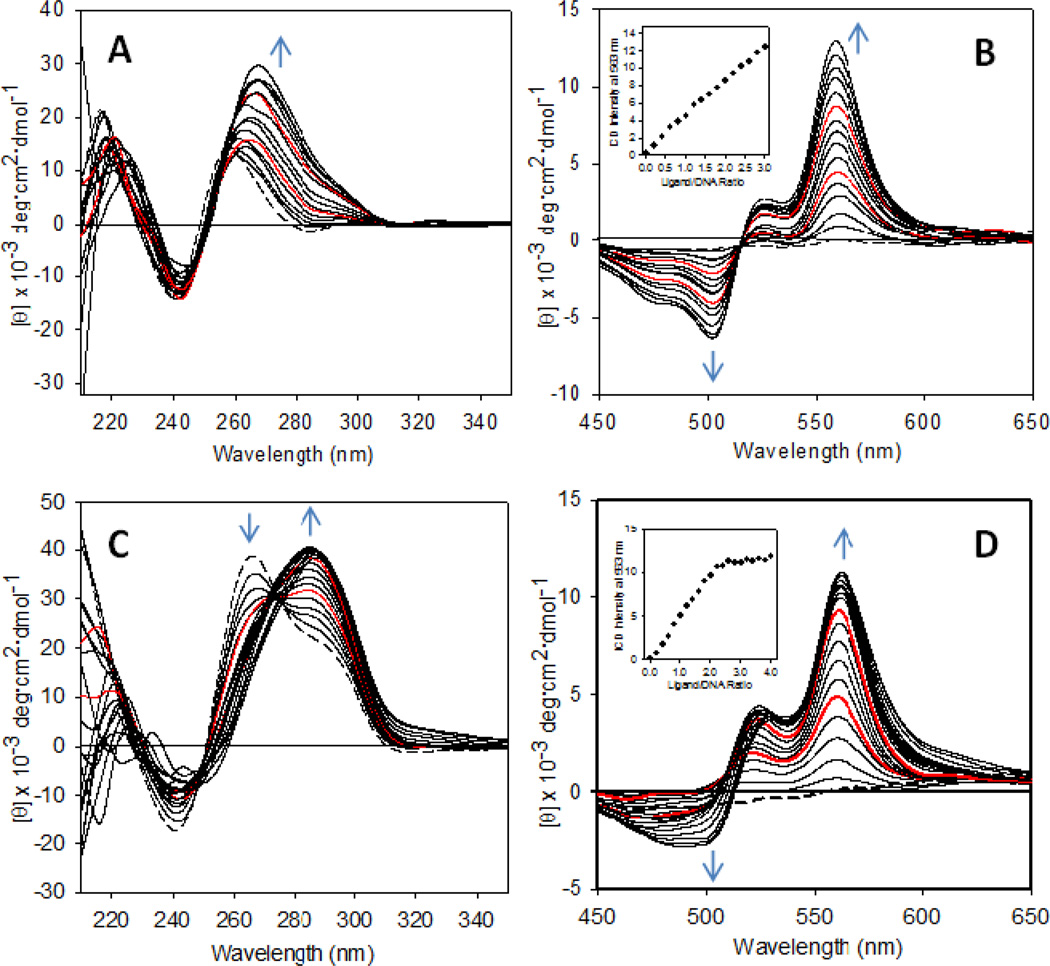
Figure 2.
CD spectra recorded for the titration of sequences dG-8 and dG-12 with compound 7 in K+-containing solution. (A) and (C) show changes in the DNA region and (B) and (D) show changes in the ligand (ICD) region during the addition of ligand to dG-8 and dG-12, respectively. Spectral changes with increasing ligand concentration are indicated by blue arrows. The red traces are spectra recorded after addition of 1 and 2 equivalents of ligand, and the dashed traces are spectra of the unmodified DNA. Plots of ICD intensity at 560 nm vs. ligand-to-DNA ratio are shown as insets in (B) and (D).

