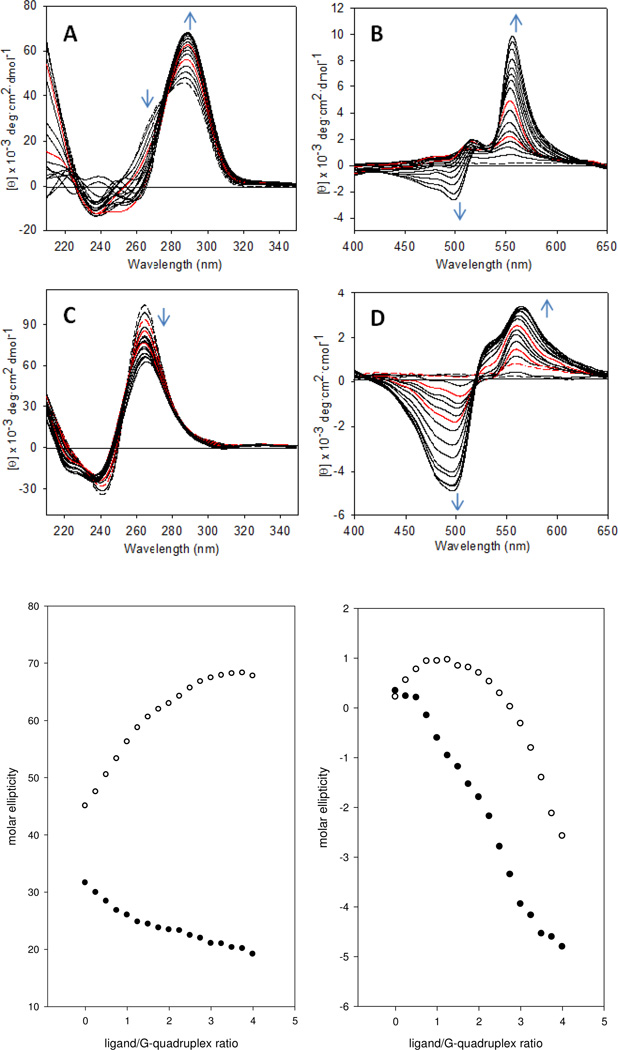
Figure 3.
CD spectra recorded for the titration of sequences dG-24 and rG-24 with compound 7 in K+-containing solution. (A) and (C) show changes in the DNA region and (B) and (D) show changes in the ligand (ICD) region during the addition of ligand to dG-24 and rG-24, respectively. Spectral changes with increasing ligand concentration are indicated by blue arrows. The red traces are spectra recorded after addition of 1 and 2 equivalents (A, B) or 0.5 (dashes), 1, and 2 equivalents (C, D) of ligand, and the dashed black traces are spectra of the unmodified DNA. (E) Plot of nucleic acid-based CD signal intensities vs. ligand concentration for dG-24 (288 nm, open circles) and rG-24 (264 nm, filled circles). (F) Plot of ligand ICD signal intensities vs. ligand concentration for dG-24 (500 nm, open circles) and rG-24 (500 nm, filled circles).

