
Figure 3. Kaplan-Meier curve for the relationship between factor 6 levels and adverse events.
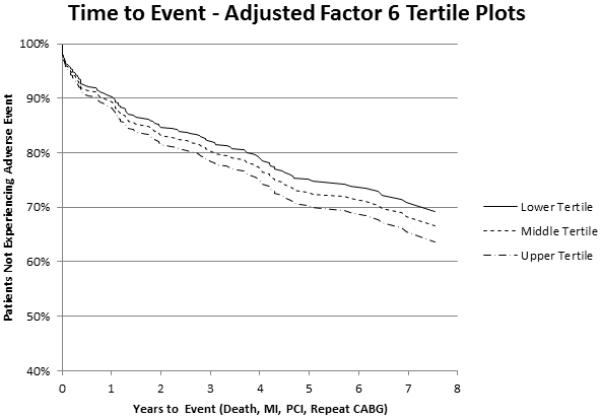
Displayed is an adjusted Kaplan-Meier curve of the relationship between tertiles of metabolite factor 6 and event-free survival after CABG, adjusted for all variables retained in the final multivariable model, demonstrating a linear relationship between factor 6 levels and decreased event-free survival.