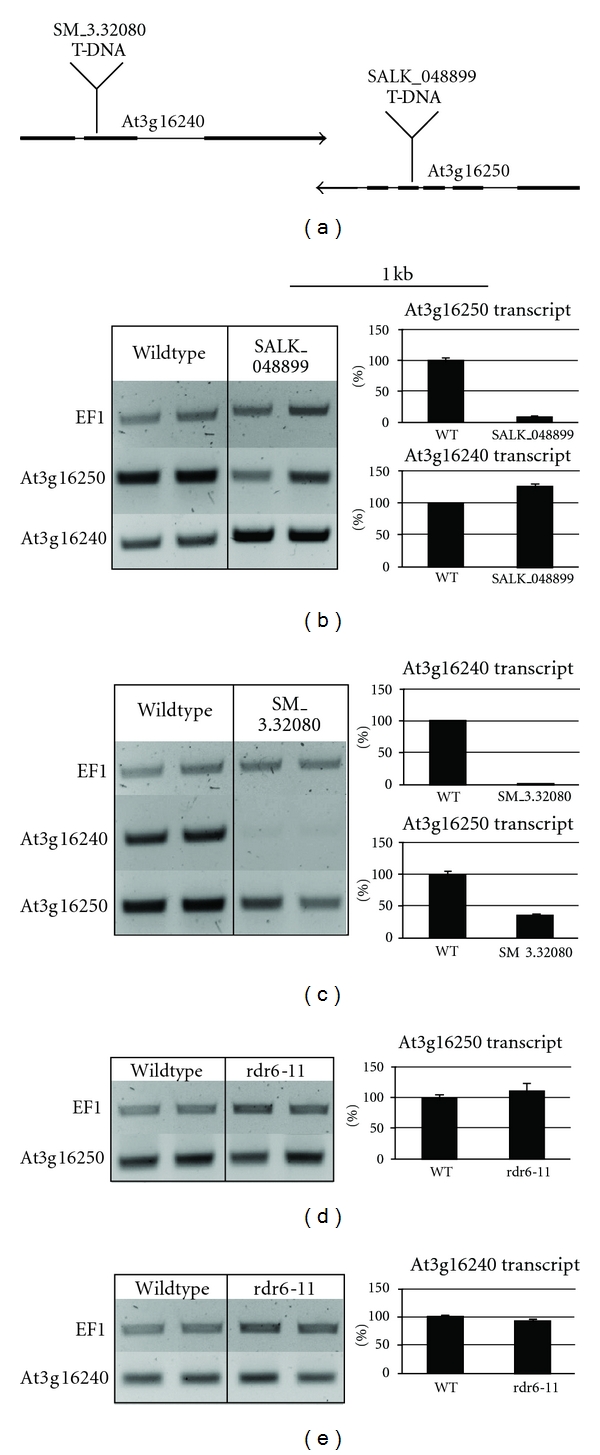
Figure 1.

Map and transcript analysis of the locus At3g16240/At3g16250. (a) Schematic map of gene pair At3g16240/At3g16250. Thick lines indicate exons, thin lines intron regions. (b) Reduced At3g16250 transcript levels and increased At3g16240 transcript concentrations in the SALK_048899 insertion line. (c) Reduced At3g16240 and At3g16250 transcript levels in the SM3.32080 insertion line. ((d), (e)) At3g16240 and At3g16250 transcript levels are not altered in a rdr6 mutant, compared to wildtype. The amount of cDNA of the semiquantitative PCR was calibrated to elongation factor 1 alpha (EF1a). Two replicas of semiquantitative RT-PCR data are shown (left). In the quantitative RT-PCR, wildtype levels were set to a reference level of 100% (right). The expression of both genes in wildtype and different mutants was examined at the same time point. The error bar represents standard error.
