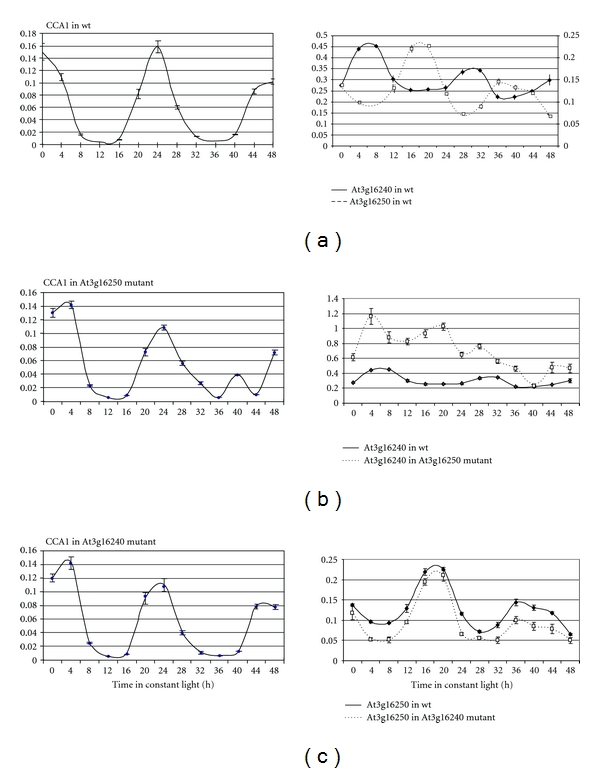
Figure 2.

Circadian expression profile of At3g16240 and At3g16250 transcripts in wildtype and T-DNA insertion lines. CCA1 transcript profiles were used as control of experimental conditions. The experiment was repeated two times in three replicas. The error bars represent standard error. (a) Antagonistic expression of At3g16240 and At3g16250 transcripts in wildtype. (b) Expression profile of the At3g16240 gene in wt and in the SALK_048899 insertion line. At3g16240 transcript levels are increased in the insertion line. (c) Expression profile of the At3g16250 gene in wt and in the SM3.32080 insertion line. At3g16250 transcript levels are slightly reduced in the insertion line.
