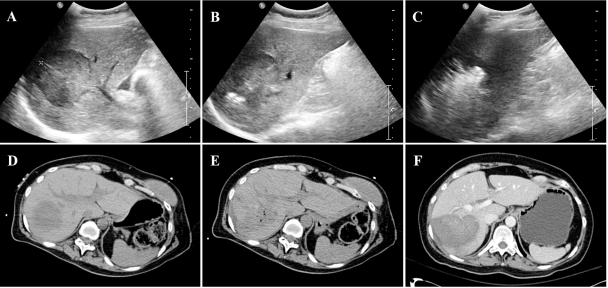
Figure 3.
Computed tomography (CT) and ultrasound imaging of radiofrequency ablation (RFA). (A) Liver ultrasound demonstrates a 5-cm hypoechoic hepatocellular carcinoma. (B) An internally cooled cluster electrode has been placed, and echogenicity at the electrode tips marks the beginning of ablation. (C) Five minutes later, echogenic microbubbles obscure the lesion and the ablation zone. (D) Preprocedure noncontrast CT depicts the same lesion. (E) After multiple ablations and repositionings, the ablation zone and the lesion are poorly defined and indistinguishable. (F) Postprocedure contrast-enhanced CT clearly defines the ablation zone.

