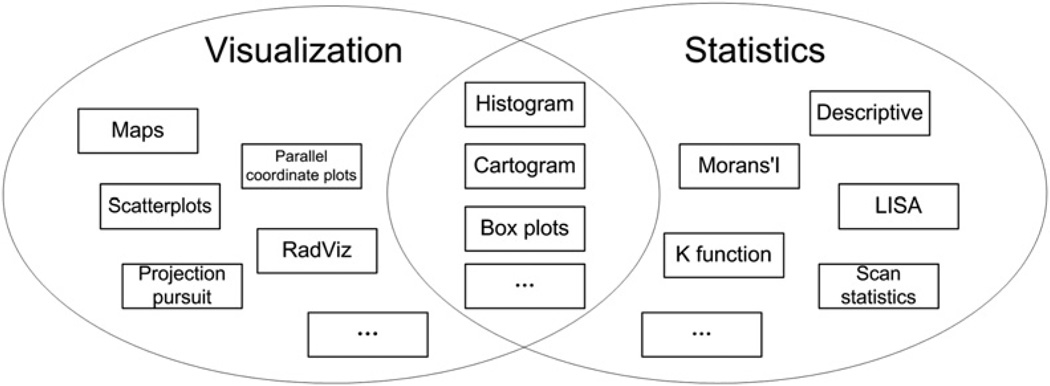
Fig. 2. ESDA Overview.
ESDA is primarily comprised of two important components: visualization and statistics. Tools of visualization include maps, scatterplots, RadViz (a method mapping high-dimensional data onto two dimensional space) and projection pursuit (a technique finding projections that can reveal structures in high-dimensional data), etc. Common statistics include basic descriptive, Moran’s I, and LISA. In addition, some elements are in the intersection of those two parts, such as histogram and cartogram.

