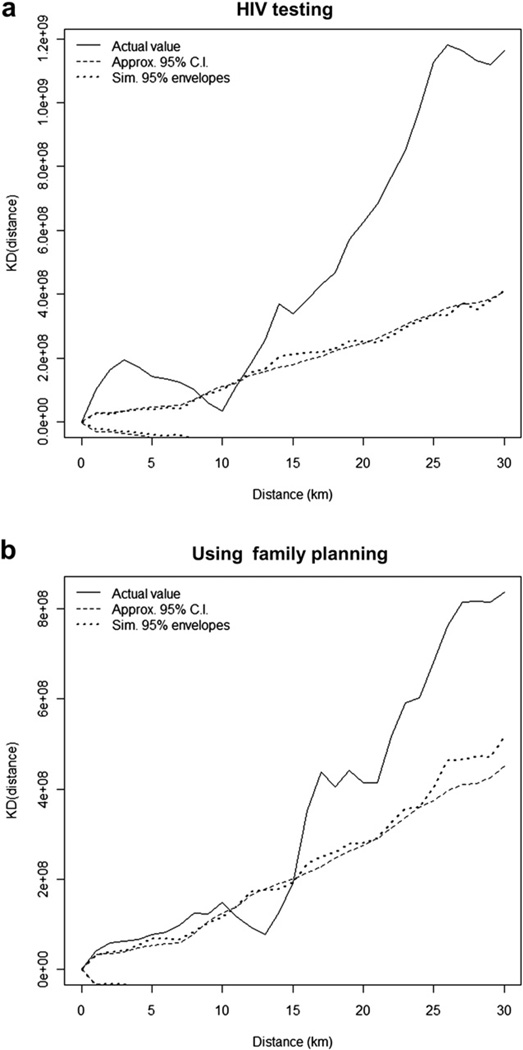
Fig. 3. Differences of K Functions.
This figure describes the differences of K functions for the two outcomes. Both outcomes have a similar spatial pattern, indicating significant clustering at smaller (less than 8 km in (a) and 10 km in (b)) or larger distances (larger than 12 km in (a) and 15 km in (b)) where estimated values are larger than those from a random distribution. No significant clustering is found in intermediate distances ([8 km, 12 km] in (a) and [10 km, 15 km] in (b)) as the curve of actual values falls within the confidence bands.

