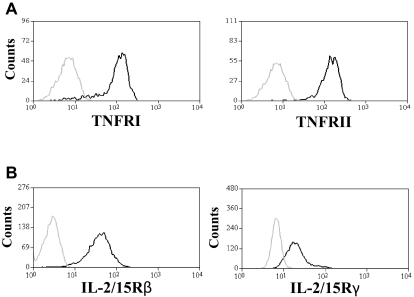
Figure 5.
NK cells express necessary receptors for interaction with TNF and IL-15. (A) Expression of TNFR1 and TNFR2 on the plasma membrane of NK cells was analyzed by FACS. The gray line represents NK-cell staining with isotype control antibody; and the black line, anti-TNFR1 and anti-TNFR2 antibody staining. Data are representative of 5 experiments. (B) Expression of IL-15Rβ and IL-15Rγ on cell surface of NK cells was tested by FACS analysis. The gray line represents NK-cell staining with isotype control antibody; and the black line, staining with anti–IL-2/IL-15Rβ and anti–IL-2/IL-15Rγ antibodies. Data are representative of 3 experiments performed.

