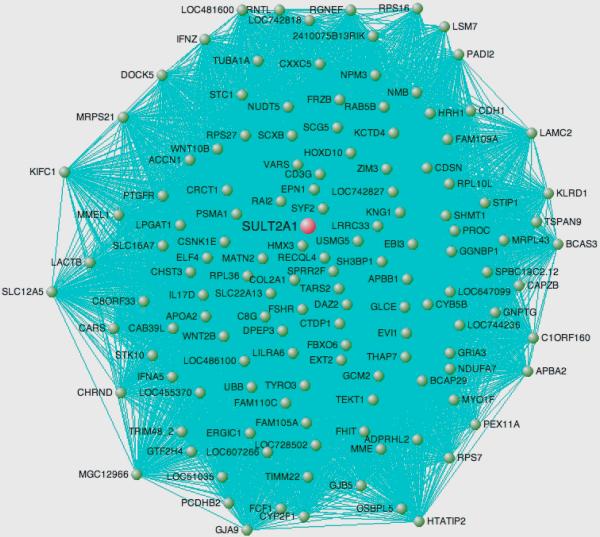
Figure 4.
Topology of gene coexpression module common to developing myocardium and hypertrophied and failing myocardium. The hub gene is colored red and all nodes are colored green. Only edges with adjacency weight > 0.7 are shown for clarity. The proximity of each gene to the center of the figure indicates its connectivity, or sum of connection weights. Genes with connectivity < 50 are omitted for clarity.

