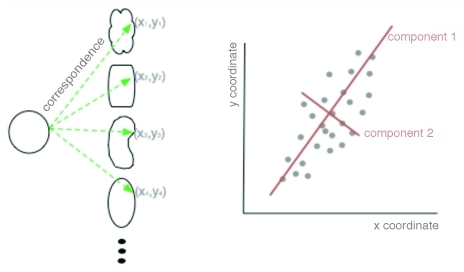
Figure 3. Schematic of principal component analysis (PCA) in geometric space. Two dimensional shapes are assigned polar coordinates (x,y) so that many, disparate shapes can be statistically compared on one graph. From this graph, the principal components of variation can be determined by which lines best identify the largest variance of the data (red lines).

An official website of the United States government
Here's how you know
Official websites use .gov
A
.gov website belongs to an official
government organization in the United States.
Secure .gov websites use HTTPS
A lock (
) or https:// means you've safely
connected to the .gov website. Share sensitive
information only on official, secure websites.
