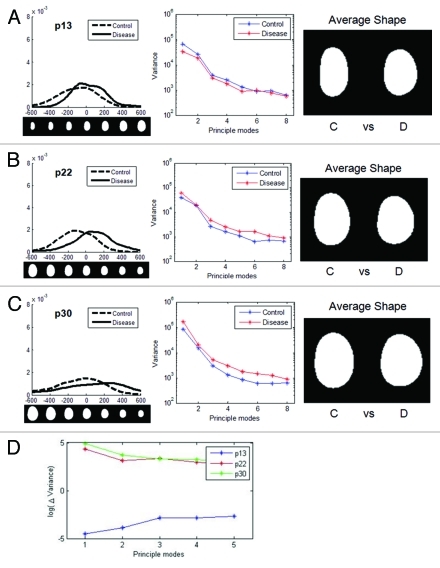
Figure 6. Changes in nuclear shape in cells from HGPS patients with increasing passage. Shapes of HGPS nuclei were compared for multiple passages. For each passage, the distribution of nuclei in the first mode, variances of the first 8 modes, and average shapes of control and disease groups are shown, respectively. The nuclear images are to scale. (A) At early passage (p13), there was some variation between the control (C) and disease (D) group. (B) At passage 22, the difference became larger. (C) At late passage (p30) there were still differences between control and disease, but the control cell nuclei began to show greater cell-to-cell variability. (D) The difference in variance between the control and disease groups for the three passages (ΔVariance = Variance disease – Variance control) show a similarity for passage 22 and 30, which are significantly different than passage 13.

An official website of the United States government
Here's how you know
Official websites use .gov
A
.gov website belongs to an official
government organization in the United States.
Secure .gov websites use HTTPS
A lock (
) or https:// means you've safely
connected to the .gov website. Share sensitive
information only on official, secure websites.
