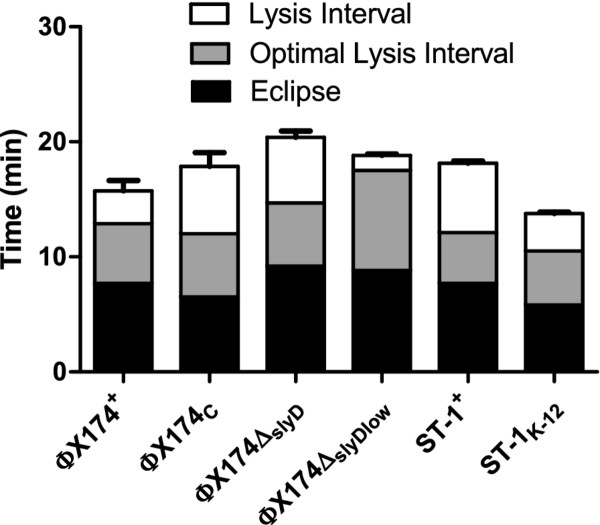
Figure 2.
Evolution of lysis interval. Black bars represent eclipse time, gray bars represent optimal lysis interval, and gray + open bars represent the observed lysis interval. In all cases observed lysis interval is longer than the predicted optimum. Optimal lysis interval changes as a result of environmental changes or phenotypic evolution. Error bars for observed lysis interval show 1 standard error.

