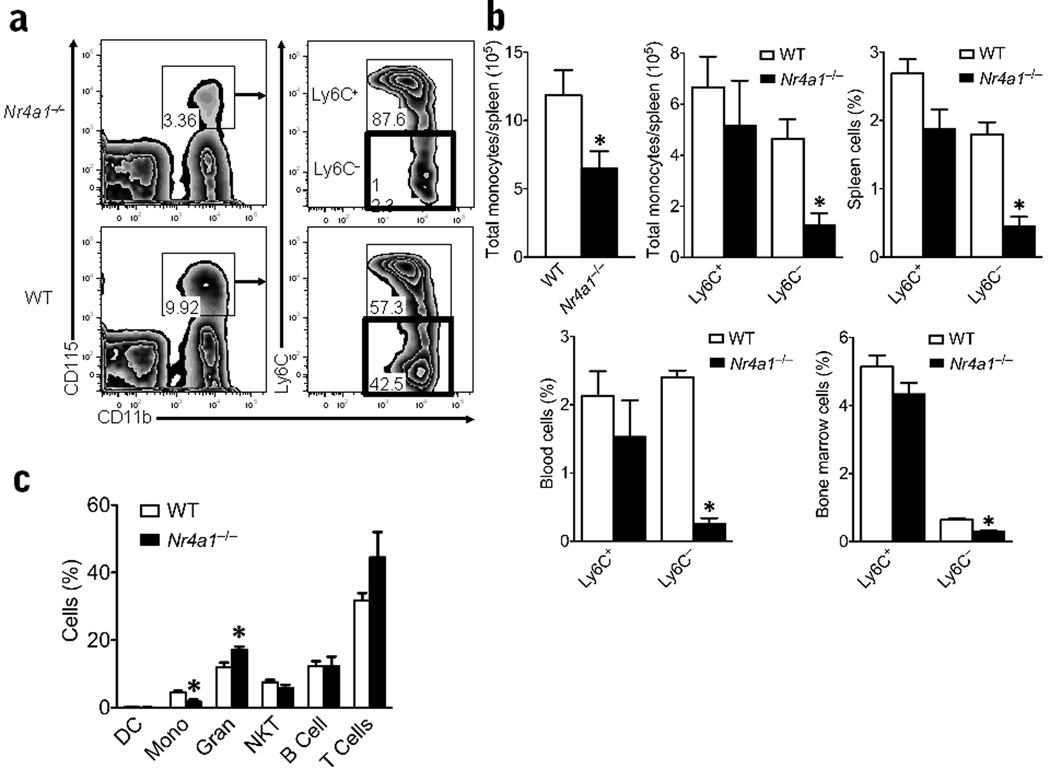
Figure 2. Absence of Ly6C− monocytes in Nr4a1−/− mice.
(a) Live cells with low side scatter and Lin− (CD3ε, CD19, CD49b, Ly6G) were plotted for CD115+ and CD11b+ expression and then gated for Ly6C+ and - expression. Representative flow cytometric scatter plot of CD11b+CD115+ monocyte populations further gated on Ly6C + or - expression in spleens of Nr4a1−/− mice or wild-type (WT) control mice (percentage of total population displayed on plot; red box highlights Ly6C− monocyte population). (b) Quantification of the number of total monocytes/spleen (left panel), the number of Ly6C + and – monocytes/spleen (center panel), and the percent of Ly6C + and – monocytes/spleen of all live cells (right panel) analyzed by flow cytometry (*P < 0.001, n = 10 mice/group). Quantification of Ly6C + and – monocyte populations in blood and bone marrow of global Nr4a1−/− mice and wild-type control mice analyzed by flow cytometry (bottom panel). (*P < 0.001, n = 10 mice/group) (c) Quantification of other major hematopoietic cell populations found in the blood of global Nr4a1−/− mice and wild-type control mice analyzed by flow cytometry (*P <0.01, n = 10 mice/group). Results are expressed as % of live cells unless otherwise noted.

