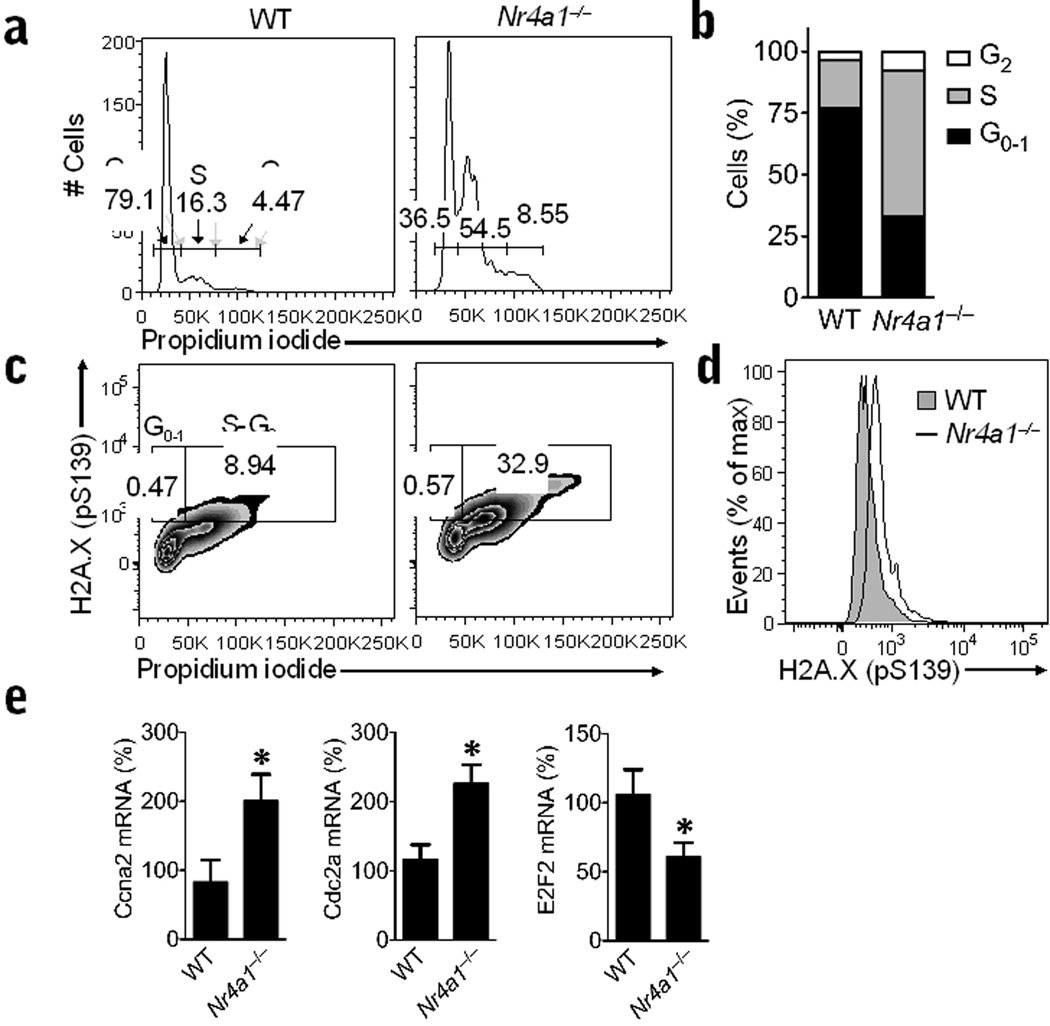
Figure 6. Abnormal cell cycle and DNA damage in Ly6C− monocytes from Nr4a1−/− mice.
(a) Representative flow cytometry analysis of cell cycle progression in bone marrow Ly6C− monocytes from wild-type (WT) control or Nr4a1−/− mice stained with propidium iodide. Gates show percentage of cells in G1-0 phase (left), S phase (middle), and G2 phase (right) of the cell cycle. (b) Quantification of data in panel A expressed as an average percentage of cells in each phase of cell cycle (*P < 0.009, n = 6 mice/group). (c) Representative flow analysis of DNA damage during cell cycle progression in bone marrow Ly6C− monocytes from wild-type control or Nr4a1−/− mice as measured by H2A.X phospho-serine139 and propidium iodide staining. Gates show percentage of cells in G1-0 phase (left) and S-G2 phase (right) of the cell cycle. (d) Representative histogram showing H2A.X phospho-serine139 measurement of DNA damage in bone marrow Ly6C− monocytes from wild-type control or Nr4a1−/− mice. (e) Relative expression of Cyclin A2 (Ccna2), Cdk1 (Cdc2a), and E2F2 (E2f2) transcripts in Ly6C− monocytes isolated by FACS from bone marrow of Nr4a1−/− or wild-type mice and measured by qRT-PCR. (*P < 0.05, n = 6 mice/group, expressed as a percentage of wild-type transcript).

