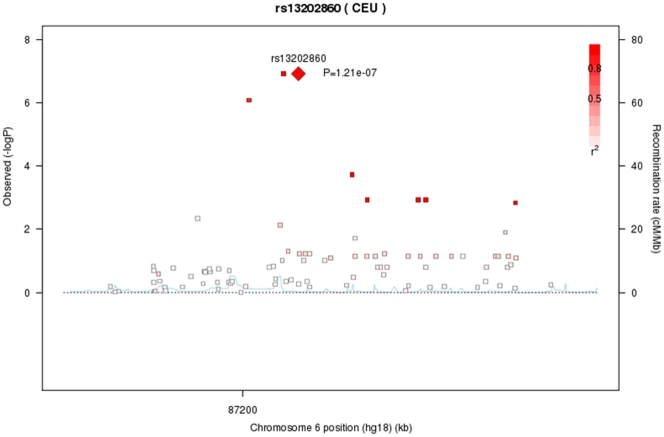
Figure 2. Association scatter plot for SNPs in the gene desert approximately 1Mbp upstream of the HTR1E gene.
TwinsUK discovery cohort. Negative logarithms of the P values for the association of each SNP with spherical equivalence are plotted. The lead SNP is plotted in diamond shape, with the GWAS-analysis P value for that SNP indicated. Genotyped SNPs are plotted as squares, with the colour indicating the degree of pairwise LD between the lead and neighbouring SNPs. Red indicates strong pairwise LD, with r2≥0.8; orange indicates moderate LD, with 0.5<r2<0.8 yellow indicates weak LD, with 0.2<r2<0.5; and white indicates no LD, with r2<0.2. The recombination rates are shown as light blue line.

